Healthcare analytics roles don't just need dashboards — they need people who can write the queries that feed them. I wanted to get into real Medicare billing data and see what revenue cycle dynamics actually look like at the national level. So I loaded the CMS Medicare Inpatient Hospitals 2023 dataset into SQLite and wrote four queries to answer the questions that would actually matter in a revenue cycle or finance role: Where are charges highest? Which procedures have the worst gaps? How do Michigan hospitals compare? And where is the reimbursement pressure most severe?
Why Revenue Cycle Matters
The gap between what a hospital charges and what it actually receives from Medicare is one of the most consequential numbers in healthcare finance. It shapes contract negotiations, informs financial planning, and sits at the center of value-based care strategy. A hospital that charges $157,000 per admission but collects $17,800 is operating under fundamentally different financial constraints than one with a tighter spread — and those constraints drive everything from staffing to service line decisions.
Understanding this at the procedure and state level is exactly the kind of analytical grounding I'd bring to a revenue cycle analyst role. You can't negotiate contracts or close care gaps without first knowing where the money is — and where it's disappearing.
Query 1 — Average Charges vs. Medicare Payments by State
I started broad: which states have the widest gap between average covered charges and average total Medicare payments? Nevada came out on top — and by a lot.
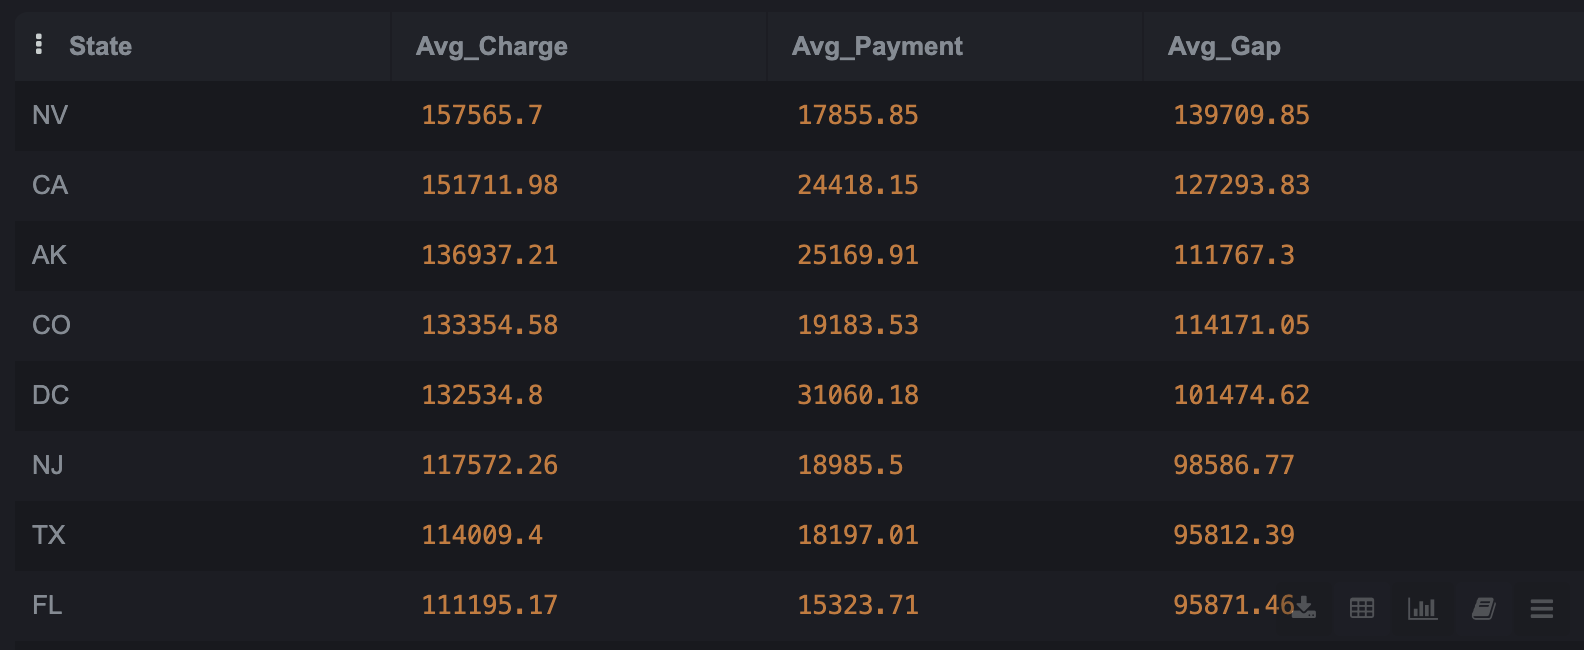
Query 1: Average charges vs Medicare payments by state — Nevada highest at $157,565 with only $17,855 paid
Query 2 — Highest-Charge Procedures
Next I wanted to know which DRG procedures drive the biggest absolute gaps. The answer was CAR-T cell therapy — and the number is staggering. A $2 million charge with $1.58 million unrecovered per patient isn't a billing anomaly, it's a window into how oncology reimbursement works (and doesn't work) under Medicare.
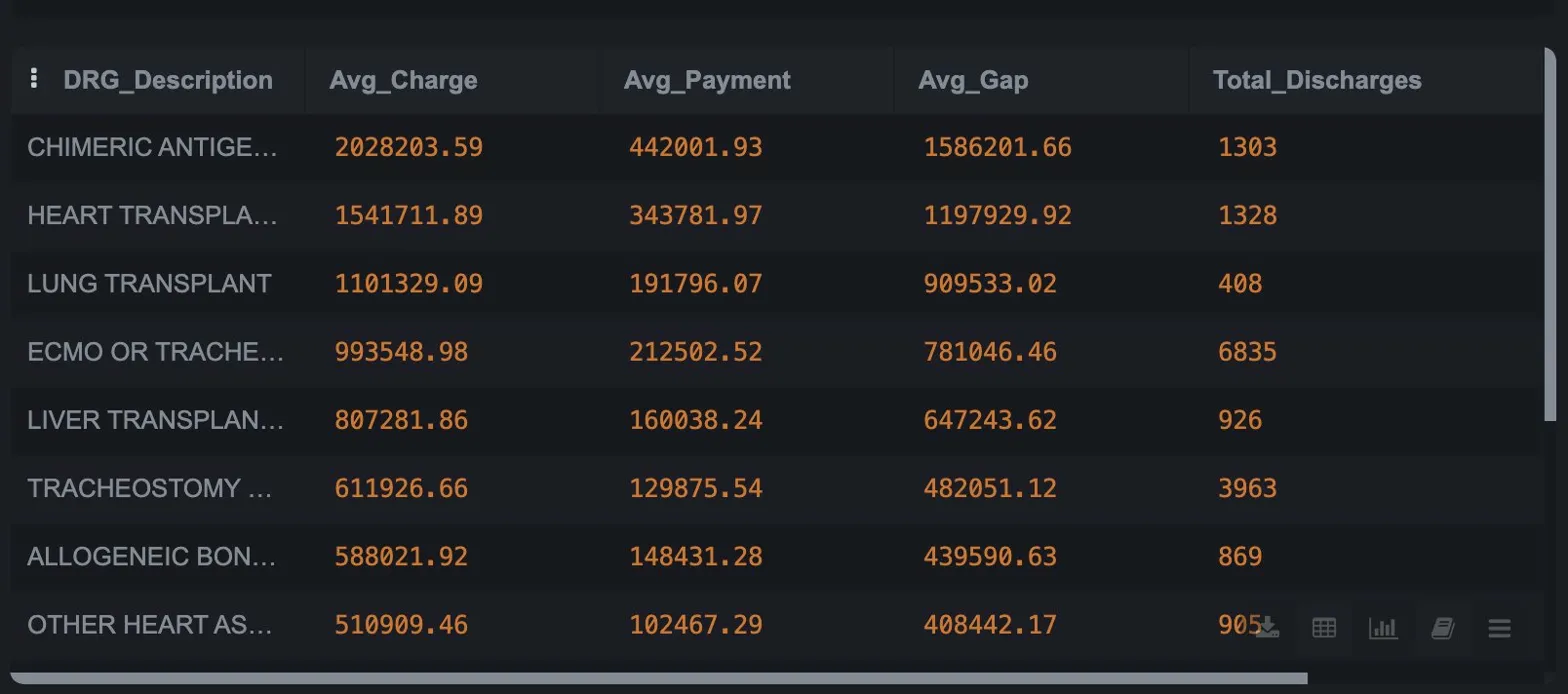
Query 2: Highest-charge procedures — CAR-T cell therapy averages $2M in charges with a $1.58M gap per patient
Query 3 — Michigan Hospital Billing
This is the query I cared most about personally. I filtered to Michigan and ranked hospitals by average charges to see how Detroit and Ann Arbor health systems compare. ECMO and transplant procedures at major academic medical centers show gaps exceeding $1M — exactly the kind of data point that shapes financial planning at a system like Henry Ford or Michigan Medicine.
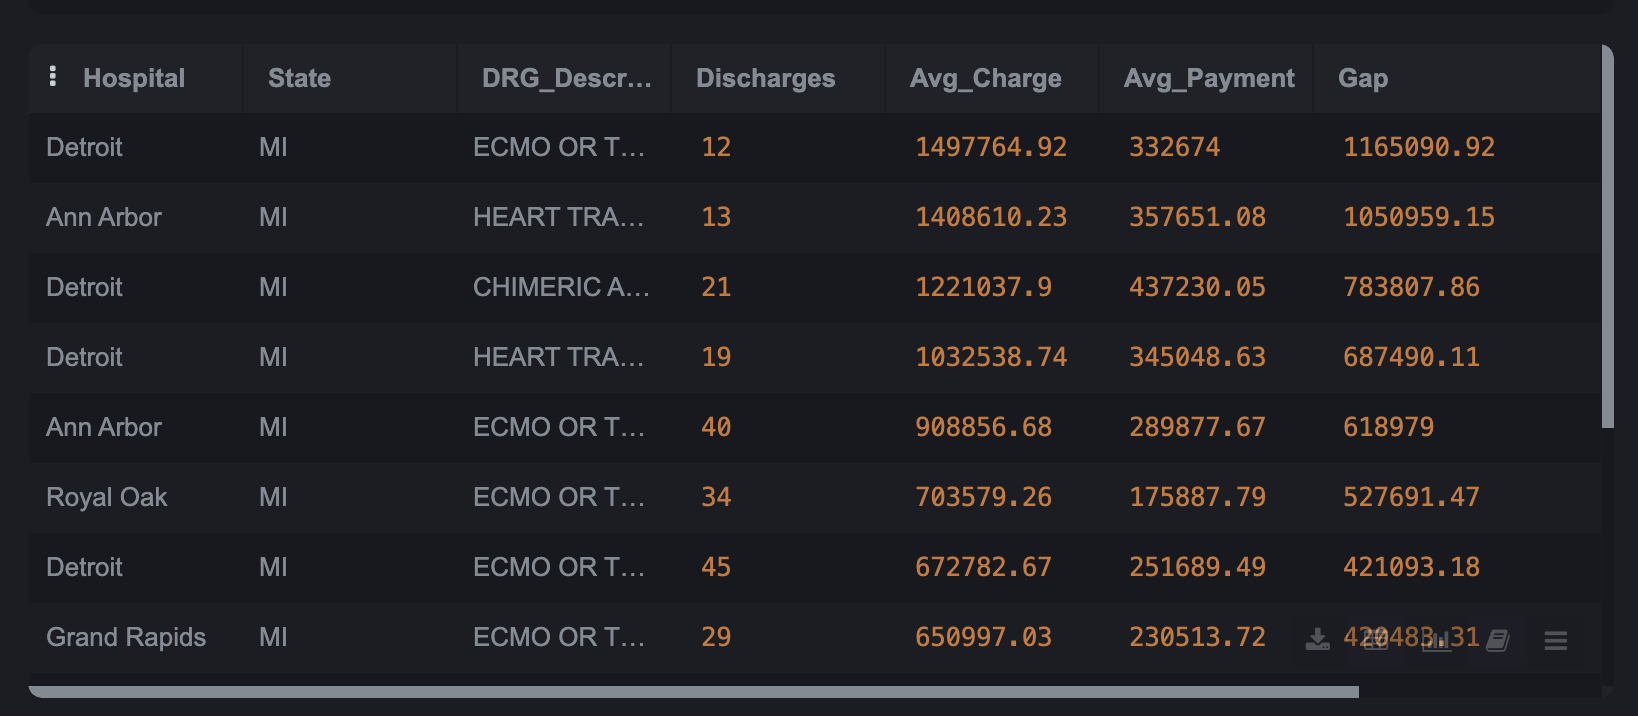
Query 3: Michigan hospital billing — Detroit and Ann Arbor hospitals show gaps exceeding $1M for complex procedures
Query 4 — Percentage Gap by State
The absolute dollar gap tells one story. The percentage gap tells another. Nevada
doesn't just have high charges — it collects only 11 cents per dollar billed.
That 88.7% gap is what makes this data so striking: the charge is almost meaningless
as a signal of actual revenue. This query used CAST to handle the
division correctly and ROUND to keep the output clean.
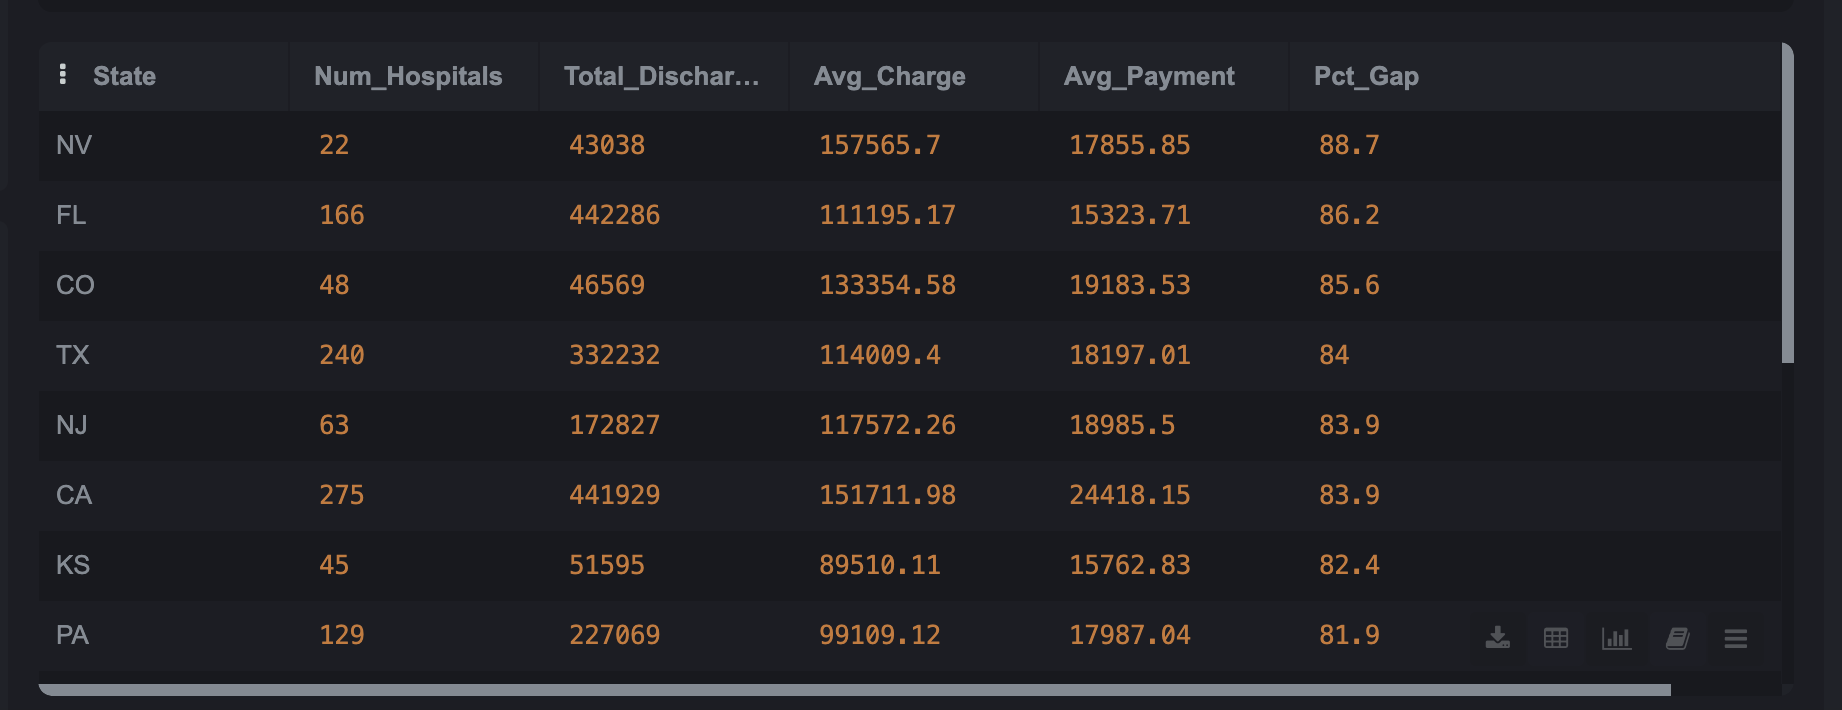
Query 4: Percentage gap by state — Nevada collects only 11 cents per dollar charged (88.7% gap)
What the Data Actually Shows
Nevada's gap is structural, not incidental. $157,565 in average charges with only $17,855 collected isn't a billing error — it reflects how chargemaster pricing disconnects from Medicare reimbursement rates in high-cost markets. Understanding this dynamic is essential for any contract modeling work.
CAR-T cell therapy exposes the limits of Medicare's DRG model. A $1.58M gap per patient isn't something a health system absorbs quietly — it drives referral patterns, payer mix decisions, and financial planning conversations at the executive level. SQL surfaces this; strategy lives in understanding why.
Michigan's academic medical centers carry the state's highest-complexity billing. ECMO and transplant procedures at Detroit and Ann Arbor hospitals show gaps exceeding $1M — which is exactly why systems like Henry Ford and Michigan Medicine have dedicated revenue cycle teams doing this analysis.
Florida's volume story is its own kind of pressure. 166 hospitals, 442,286 discharges, and an 86.2% gap means reimbursement shortfalls are multiplied across a massive patient base. High volume doesn't solve the gap problem — it compounds it.
SQL Concepts Demonstrated
These four queries cover the core toolkit for analytical SQL in a healthcare data environment:
Where I'd Take This Next
The natural extension is joining this dataset with hospital quality ratings — do higher charges correlate with better outcomes, or is the relationship murkier than that? I'd also add CTEs to compute running totals by state or DRG category, and filter down to specific service lines (cardiac vs. oncology reimbursement behave very differently under Medicare's DRG methodology).
At scale, this analysis would move into a cloud data warehouse — BigQuery or Snowflake — where you can join CMS billing data with quality metrics, SDOH layers, and payer mix data in a single analytical environment. That's the version that actually informs contract strategy.