A three-task graduate research project building, tuning, and comparing MLP (Multilayer Perceptron), RBF (Radial Basis Function) networks, and SVM (Support Vector Machine) models across distinct problem domains: SPC pattern recognition, plasma etching regression, and multi-font character classification.
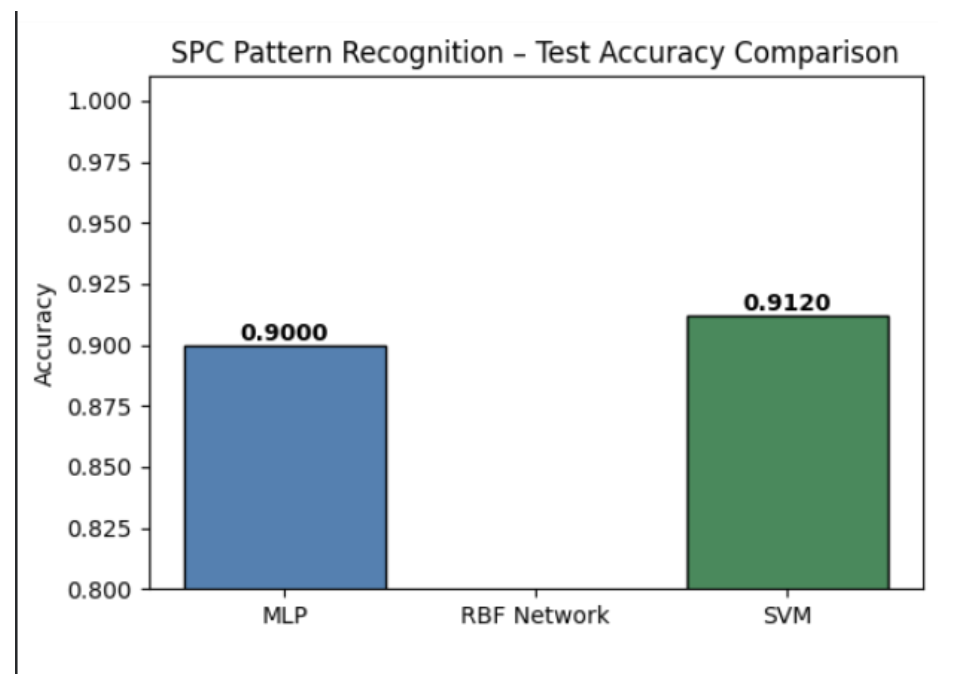
SPC Pattern Recognition test accuracy: SVM 91.2%, MLP 90.0%, RBF 40%
Task 1 — SPC Pattern Recognition
Identified control chart patterns (normal, cyclic, trending, upward/downward shift) across Statistical Process Control datasets. Tuned MLP hidden layer sizes and learning rates, RBF kernel bandwidth, and SVM kernel type and regularization parameter C.
- SVM: 91.2% — best overall; recommended for production SPC monitoring
- MLP: 90.0% — strong generalization with proper regularization
- RBF Network: collapsed to ~40% — sensitive to bandwidth initialization, unstable on this dataset
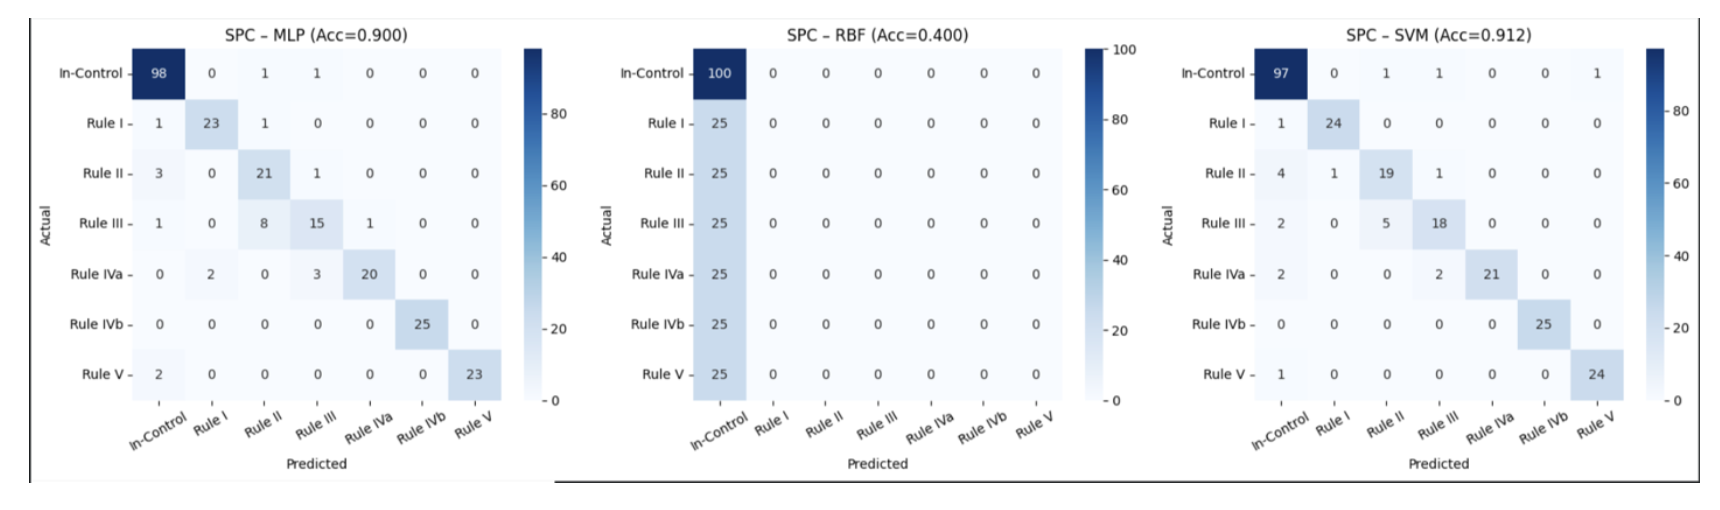
Confusion matrices for all three models on the SPC task — SVM and MLP both achieve strong classification across 7 rule violation classes
Task 2 — Plasma Etching Regression
Predicted etch rate from process parameters (RF power, pressure, gap, flow rate). SVM with an RBF kernel outperformed neural network approaches on held-out test data.
- SVM (best): test R² = 0.11, RMSE = 217.42 — recommended given low noise sensitivity
- MLP and RBF networks showed higher variance on small dataset; SVM generalized more reliably
- Feature analysis indicated RF power and gap as dominant predictors
Task 3 — Multi-Font Character Recognition
Multi-class classification of characters across 20 font styles. Applied PCA for dimensionality reduction before training, reducing input features while preserving discriminative variance.
- MLP: 87.2% — highest accuracy; recommended for character recognition tasks
- SVM: 85.9% — competitive with faster inference
- RBF Network: 76.9% — weakest; struggled with inter-class similarity across fonts